Population matrix tutorial
This material was summarized from a lecture I taught on blue crab population structure in the Population Ecology course (Spring 2024) at the University of Maryland. There were several lectures preceeding this one that provided more information in blue crab population dynamics.
The objective is to demonstrate how we can use population matrix to explore the fate of a population under different survival, fecundity, and harvesting scenarios. This material aims to be suitable for students with limited R experience and limited familiarity with matrix manipulation.
The blue crab life cycle, as well as the functions and parameteres used in the R tutorial, are based on Miller (2001) Matrix-based modeling of blue crab population dynamics with applications to the Chesapeake Bay.
Background: Blue crab population structure
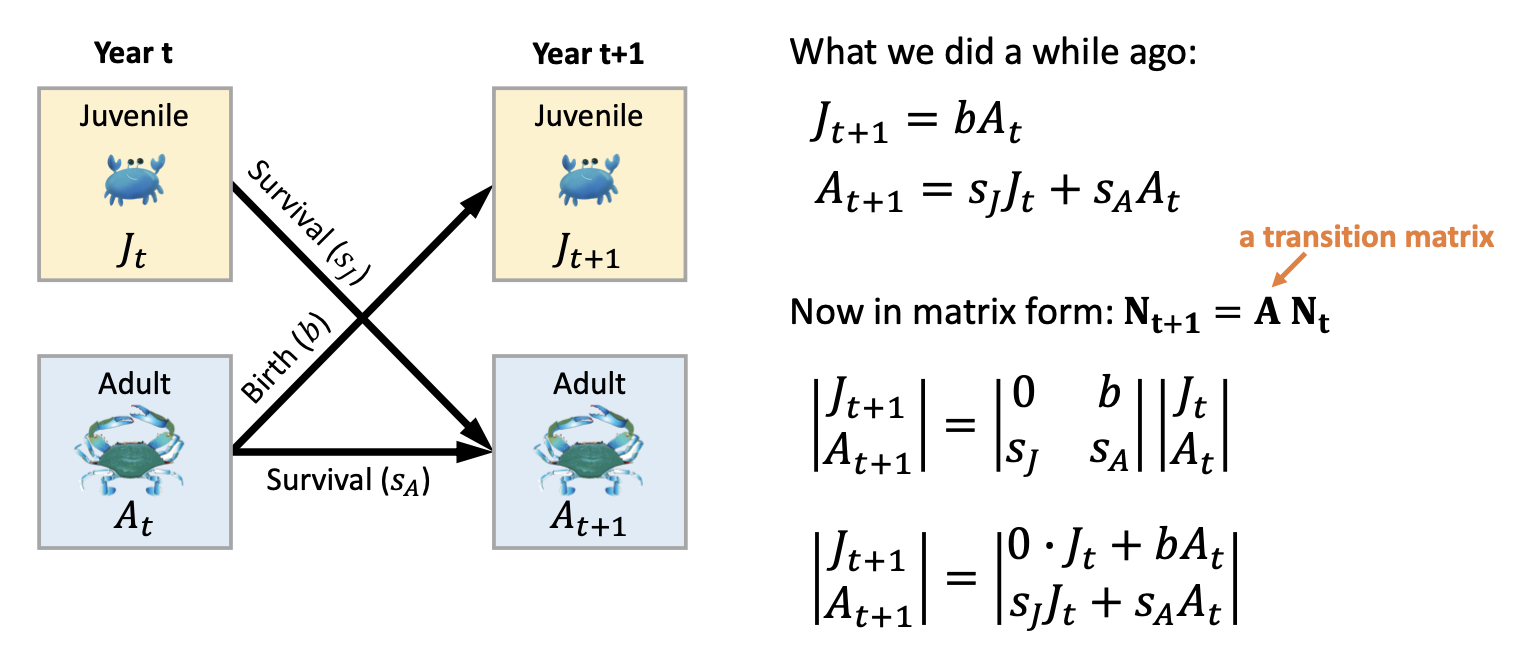
A simple example of blue crab life cycle
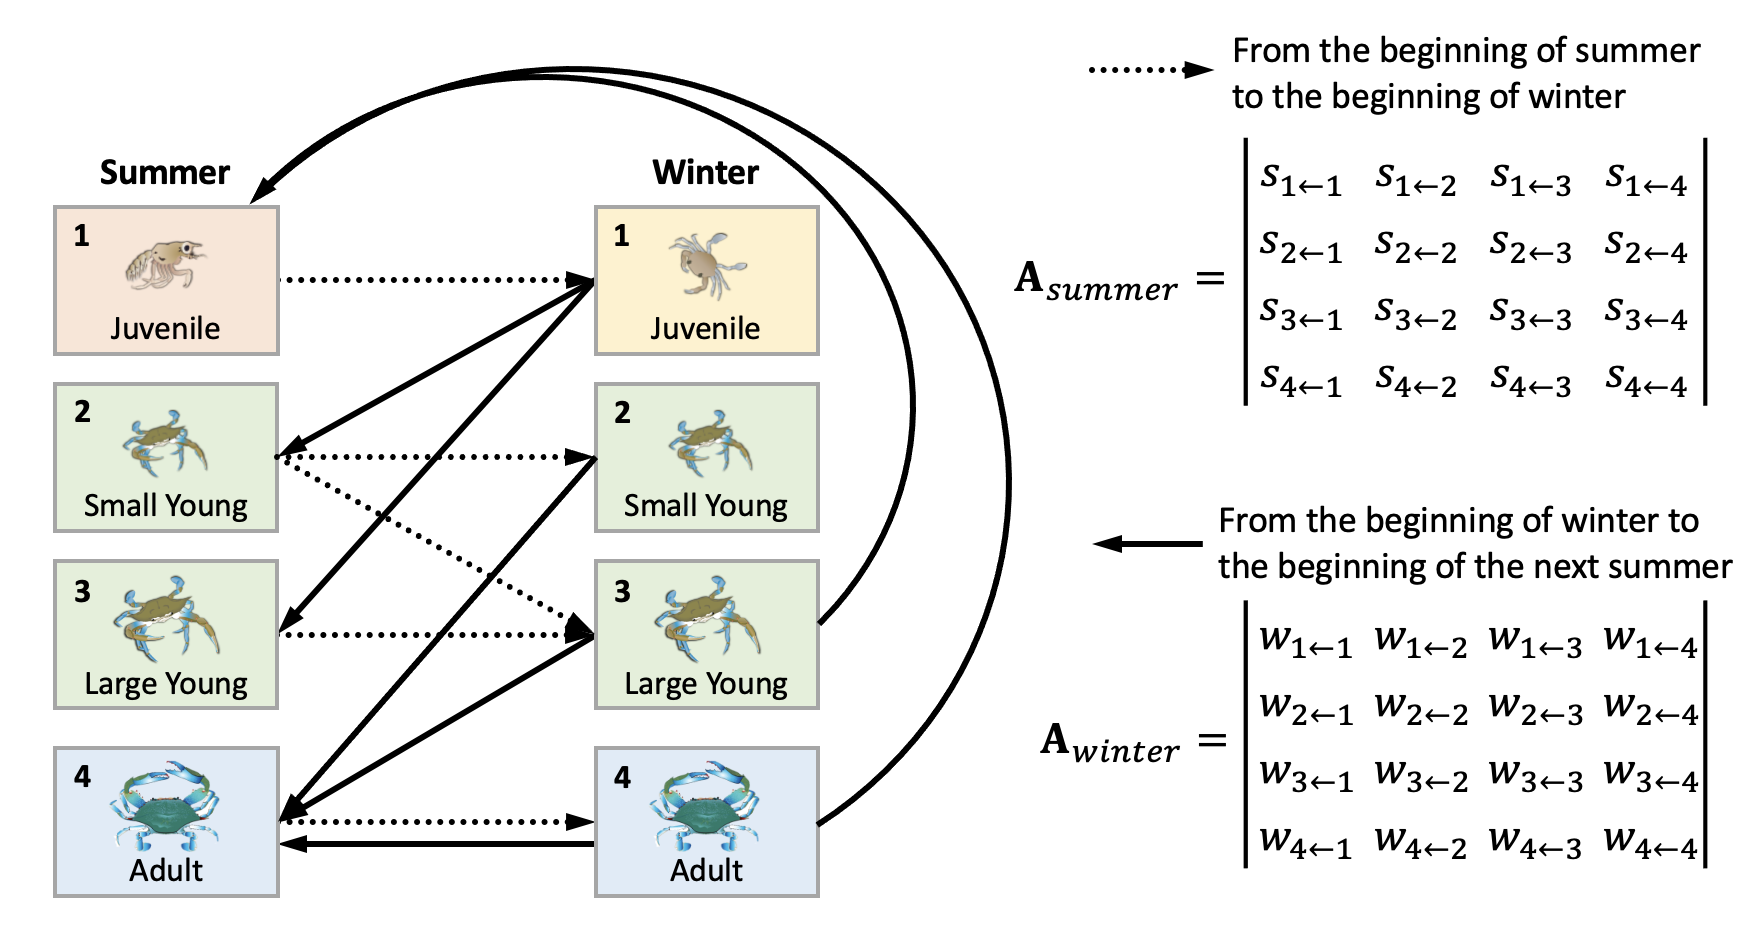
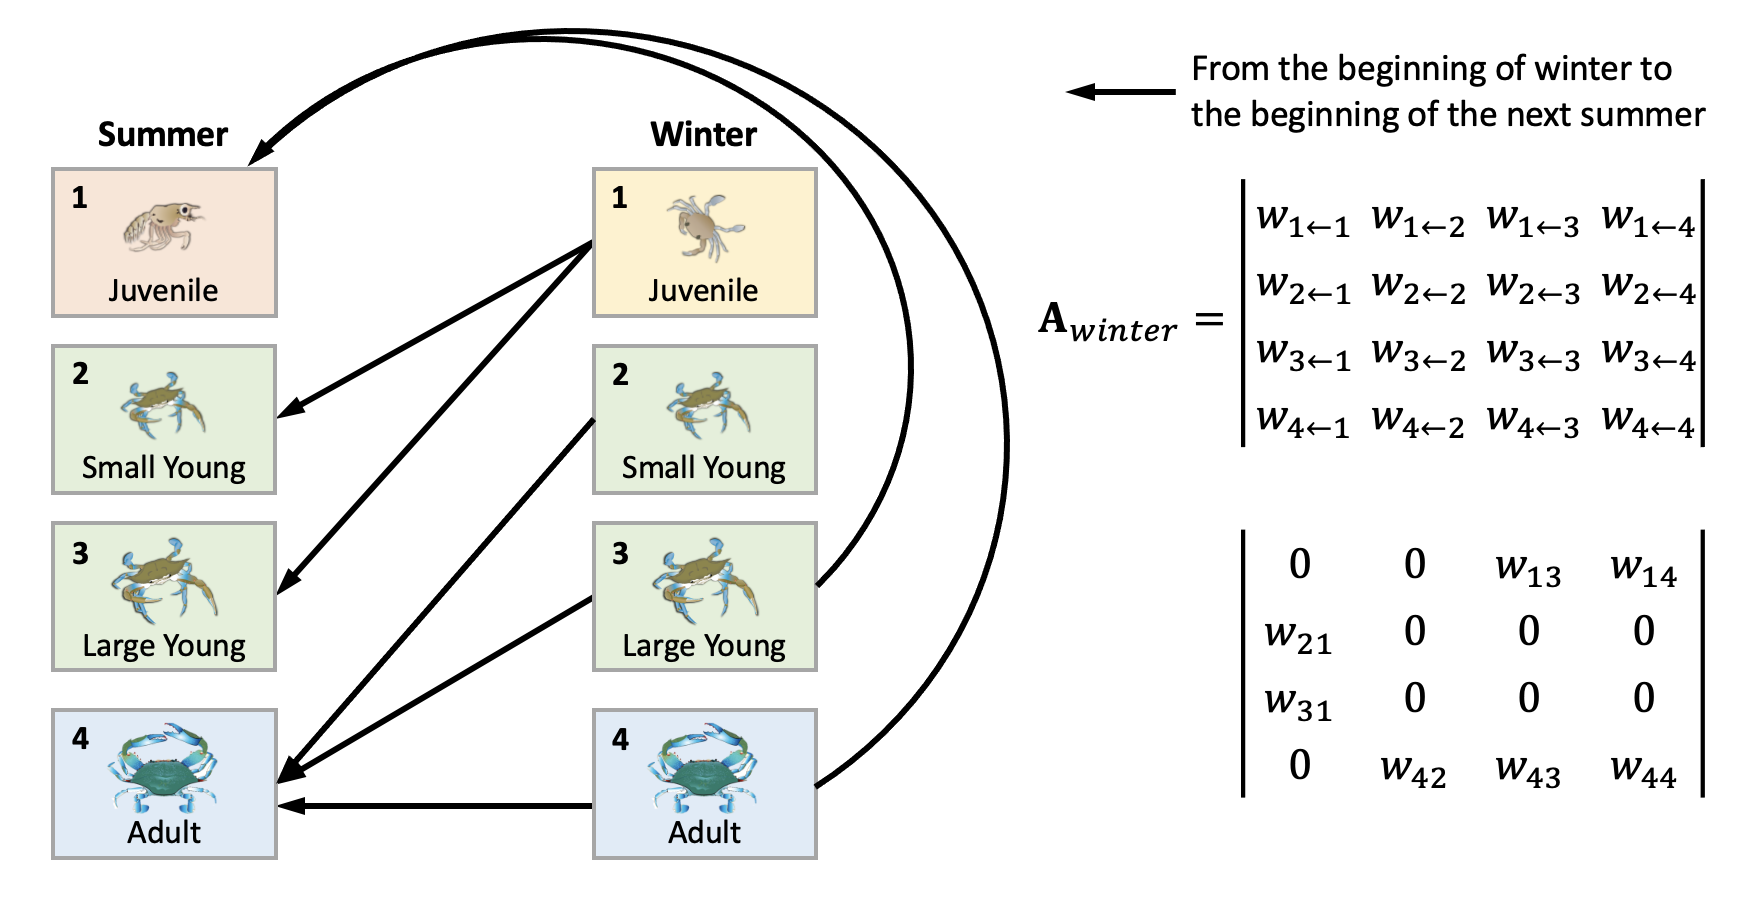
Add seasonal and spatial dynamics
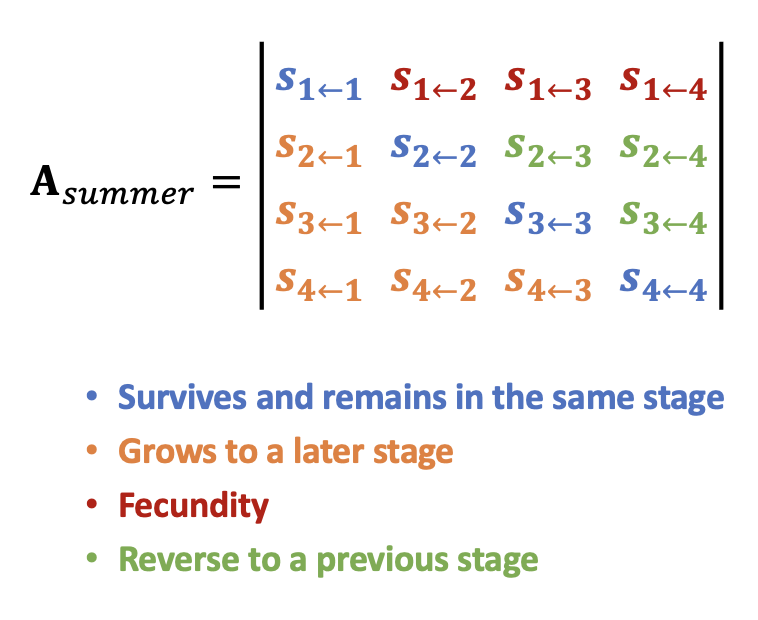
This is what each element means:
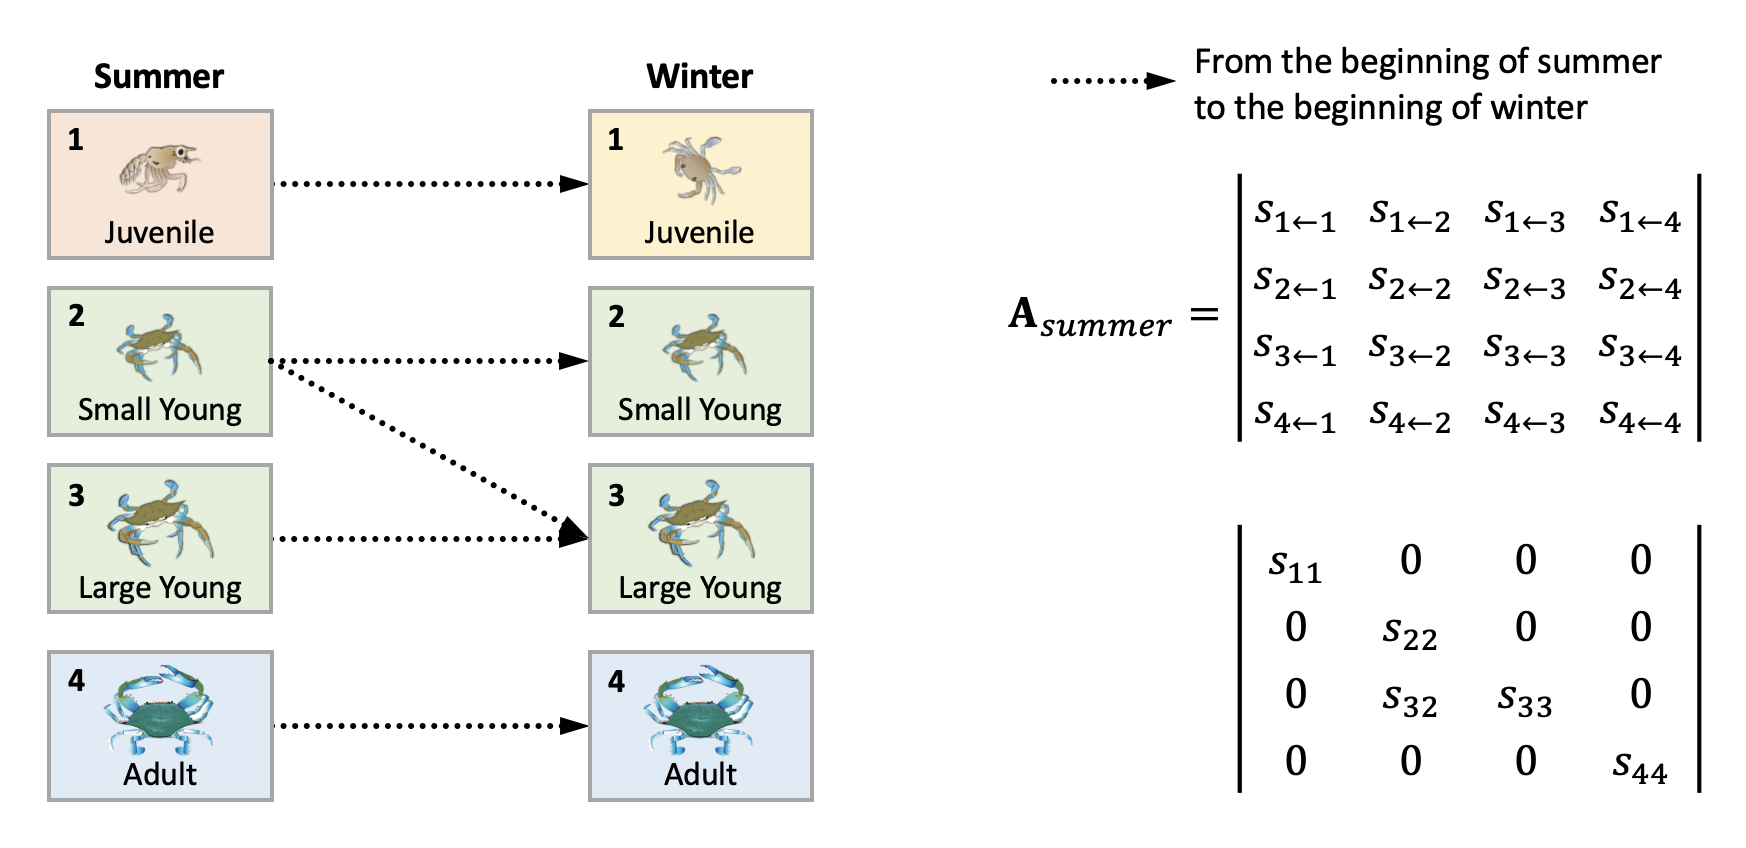
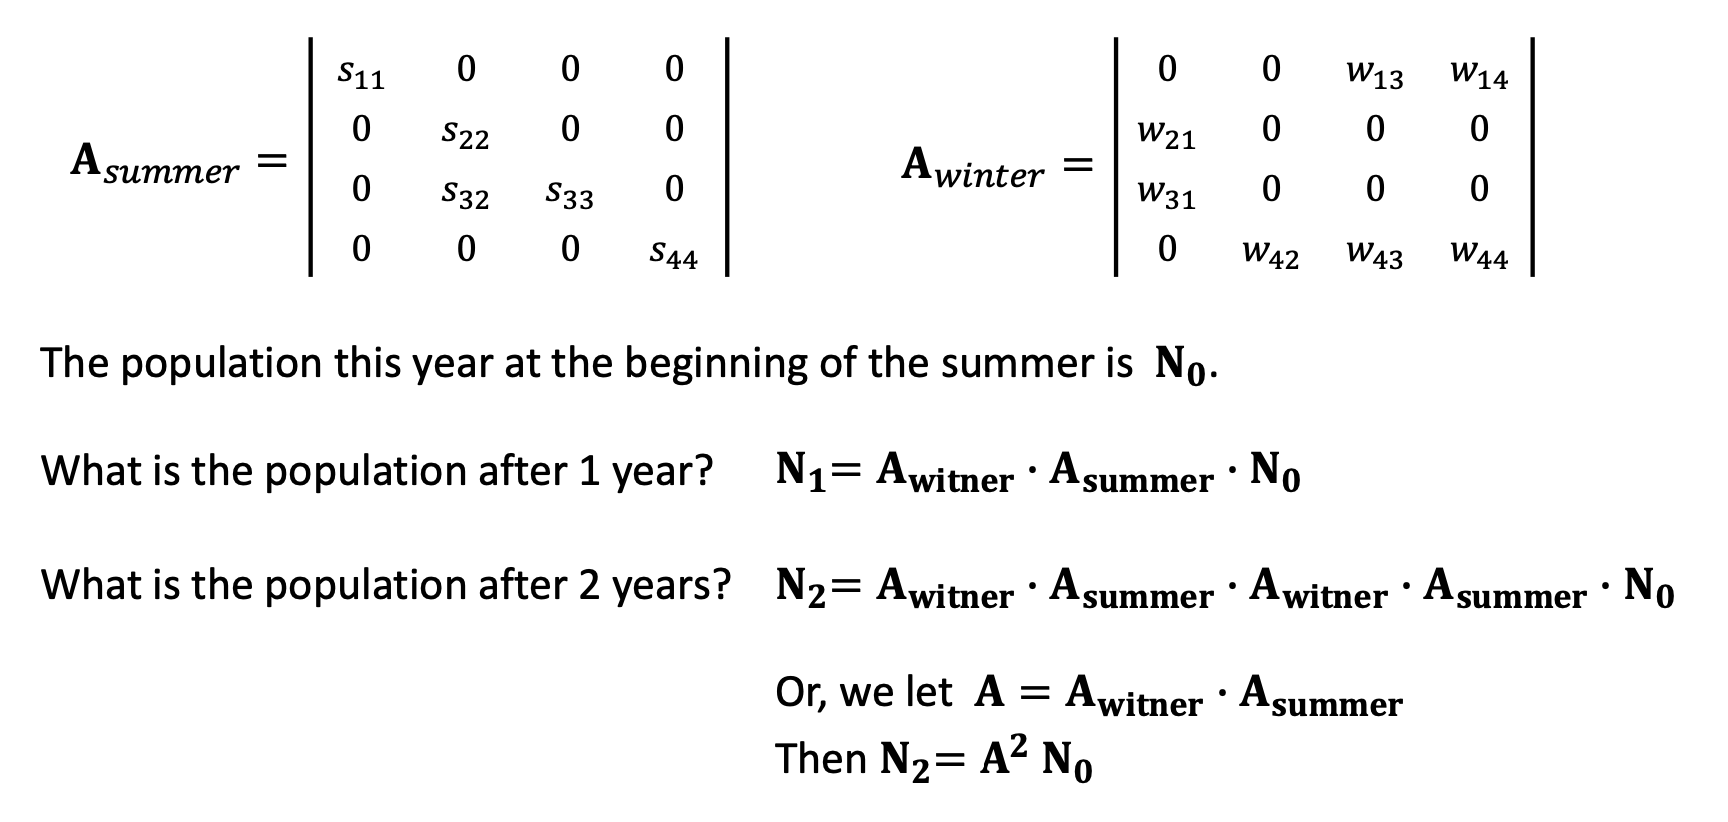
We can derive the summer and winter transition matrix separately by leaving only the elements specified (as the arrows) in the life cycle diagram. Replace the rest with 0.
Compute population for future time steps
Using the transition matrices and the current population data, we can compute population for the next year and the years after.
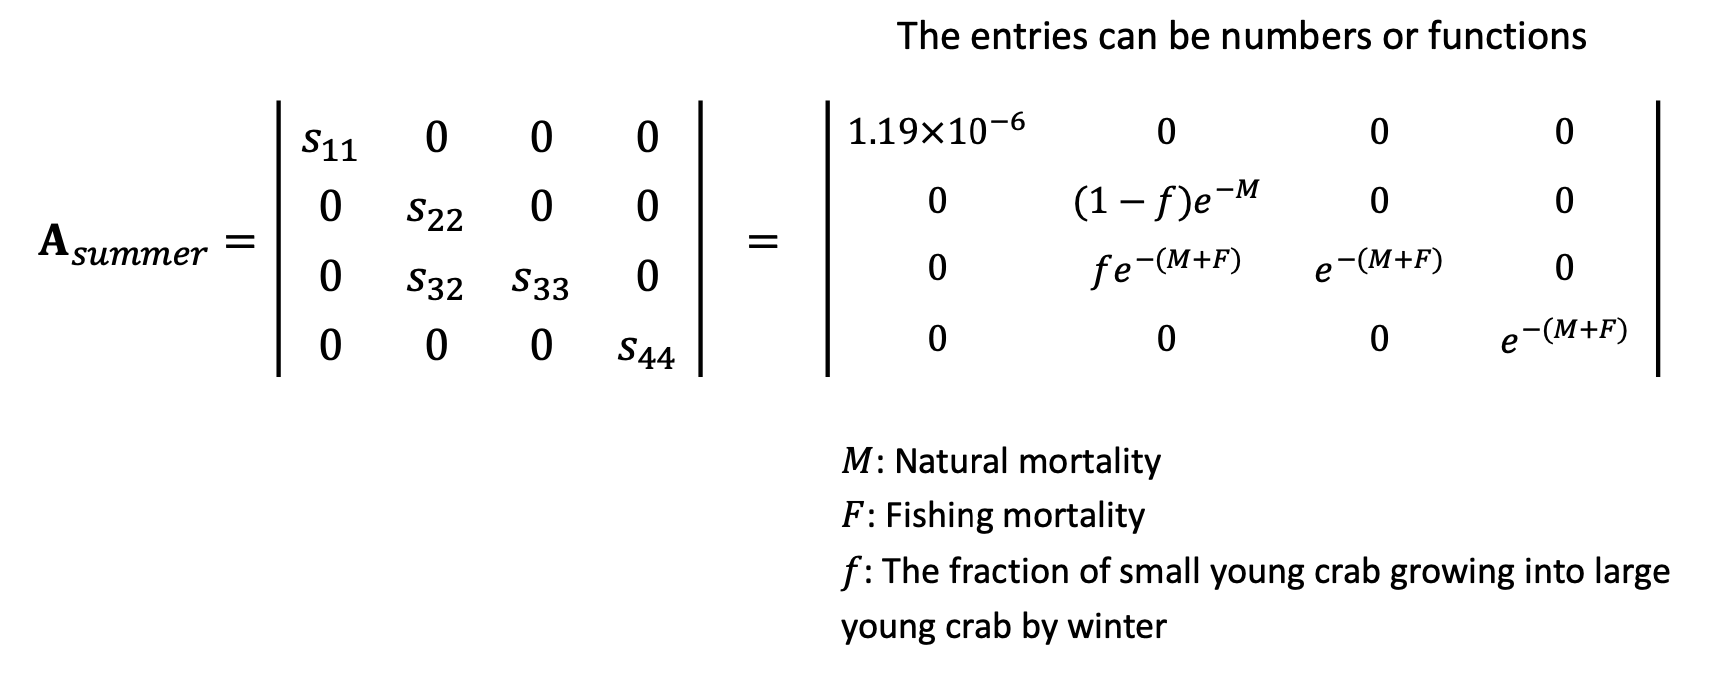
By plugging in the parameters and functions for the matrix elements, we can then calculate the actual population sizes.
R tutorial
In this tutorial, we will use the transition matrices introdued above to predict blue crab population change under different scenarios. The parameters and functions for the transition matrices (Miller 2001) are provided in the code.
Objectives
- Simulate blue crab population change with the given parameters
- Script already written. Your job is to understand the code, run it and generate result.
- Explore the fate of crab population under different scenarios (“what if” questions)
- You will need to modify the code to generate results
Initialization
Set parameters
mN = 0.1875 # natural mortality
mF = 0.45 # fishing mortality
dredge = 1 # winter dredge fishing mortality multiplier (1: same intensity as summer fishing; 0: no winter dredging)
fecundity = 1600000 # fecundity (per capita number of offspring)
f = 0.15 # fraction of small/juvenile crabs growing into large young crabs
larva_survival = 0.000001196 # survival of larvae into juveniles
Derive entries of the transition matrix
s11 = larva_survival
s22 = (1-f) * exp(-mN)
s32 = f * exp(-mN)
s33 = exp(-(mN + mF))
s44 = exp(-(mN + mF))

w13 = 0.66 * fecundity * exp(-(mN + dredge*mF))
w14 = fecundity * exp(-(mN + dredge*mF))
w21 = (1-f) * exp(-mN)
w31 = f * exp(-mN)
w42 = exp(-mN)
w43 = exp(-(mN + dredge*mF))
w44 = exp(-(mN + dredge*mF))
Create summer transition matrix
A_summer = matrix(data=c(s11, 0,   0,   0,
                         0,   s22, 0,   0,
                         0,   s32, s33, 0,
                         0,   0,   0,   s44),
                  ncol=4, nrow=4, byrow=TRUE)
A_summer # print matrix
Create winter transition matrix
A_winter = matrix(data=c(0,   0,   w13, w14,
                         w21, 0,   0,   0,
                         w31, 0,   0,   0,
                         0,   w42, w43, w44),
                  ncol=4, nrow=4, byrow=TRUE)
A_winter
Create initial population as a vector (Juvenile, Small young crab, Large young crab, Adult)
N1 = c(100, 100, 100, 100)
Simulate population change
Basic info of matrix multiplication:
%*%is the operator for matrix multiplication in R- $AB$ does not equal to $BA$
- $(AB)C$ equals to $A(BC)$
Demonstration of matrix multiplication
A_summer %*% N1 # population after a summer
A_winter %*% A_summer %*% N1 # after 1 year
A_winter %*% A_summer %*% A_winter %*% A_summer %*% N1 # after 2 years
Alternatively
A = A_winter %*% A_summer
A %*% N1 # after 1 year
A %*% A %*% N1 # after 2 year
Simulating population for multiple years
# total years for simulation
year = 20

# create an empty matrix to store simulated population data
N = matrix(NA, ncol=year, nrow=4)

# assign initial population for year 1 (as the first column of matrix N)
N[,1] = N1

# simulate population change
for (i in 2:year) {
  # store each year's population in the matrix
  N[,i] = A %*% N[,i-1]

  # print the population growth rate
  growth = sum(N[,i]) / sum(N[,i-1])
  print(growth)
}
N # print matrix
Plot population by year
plot(N[4,], type="l", ylim=c(0, max(N[4,]*2)), xlab="Year", ylab="N") # adult
lines(N[3,], col="red", lty=2) # add large young crab
lines(N[2,], col="blue", lty=3) # add small young crab
lines(N[1,], col="green", lty=4) # add larva
Questions: Can these strategies stop the decline of blue crab population?
- Can we stop the decline of blue crab population by placing restrictions on winter dredge fishing?
- What if we can double the survival rate of larvae? (keeping everything else as usual)
- What if we can double the fecundity of crab? (keeping everything else as usual)
- Given the following scenario altogether, will the population grow or decline?
- Winter dredge fishing is completely banned (which is actually the case);
- in response, fishermen increased summer fishing mortality by 50% to compensate for the loss in winter;
- on the other hand, the warming climate has reduced winter natural mortality by 50% for all life stages.
- Is the long-term population growth rate sensitive to the initial population structure (N1)?
- How does the “proportion of each life stage” change over time? (# of individuals in each life stage / total # of individuals)
R notes/tips
- short cut for running code: ctrl + enter (Windows) or cmd + return (Mac)
- you can select multiple lines of code to run at once
- the order you run the code matters
- R is case sensitive
- click the broom (upper right corner) to clear all stored objects
- Extract matrix entry:
N[x,y]extracts the element in row x column y in matrix N- Exponential:
exp(n)means e^n (where e is the Euler’s number)- Generate number sequence:
1:10represents a vector (a list of numbers) of 1 to 10, i.e.c(1,2,3,4,5,6,7,8,9,10)- Scientific number:
1.23e+05represents 1.2310^4, which is 12300. Similarly,1.23e-05is 1.2310^-5 = 0.000123.